Want to become one of the greatest ballers that has ever lived?

Just like legends, ballers are not born, ballers are made. The secret is hard work, effort and dedication. Once you master it, you will become a true champion; you win; you beat odds like never before. A real baller is always one step ahead of bookmakers thanks to comprehensive knowledge, the right attitude, and ice in the veins. That said, are you willing to go the extra mile to start printing money like the Federal Reserve? Well, of course, you are, or else you would not be here. So let’s cut to the chase and see how you can become one of the greatest ballers that has ever lived!
1. Introduction into BetBallers
First things first, we recommend to start with taking a look at the following videos that will give you a quick insight into BetBallers.
- https://www.youtube.com/watch?v=imItKh9KNw8&feature=emb_logo NB! Some of the functionality is out dated, but it still covers the basics that have remained unchanged since the early days.
- https://www.youtube.com/watch?v=T5-J3wrpZyc&feature=emb_logo Most of the features are up to date, you will get a good overview of the latest features.
2. Customise In-Play Layout
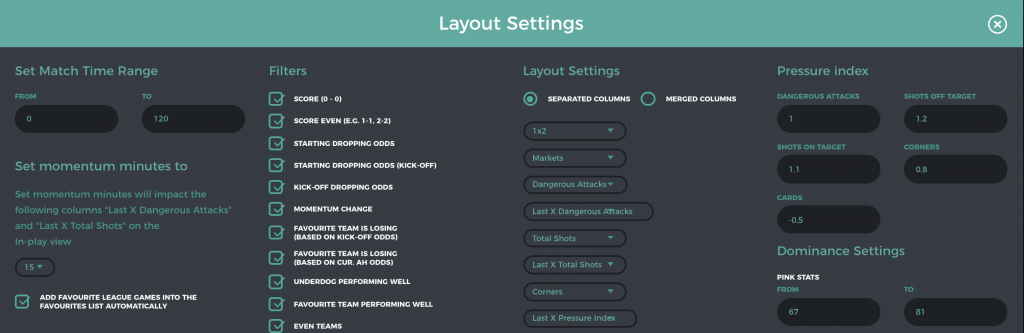
Secondly, for success on in-play betting it is essential to customise your in-play layout. Keeping everything as dynamic and customisable as possible has been one of our main principles throughout the years. We know that everyone has their own pattern and methods to find a suitable bet for themselves. Therefore, just open the Layout Settings tab and start adjusting yours.
2.1 Momentum Minutes
The momentum minutes will impact the following columns: Last X Dangerous Attacks, Last X Pressure Index stats, Last X Total Shots and Last X Corners on the In-play view. These stats show the statistics of the last X minutes and help you to understand when there has been a momentum shift in the game.
2.2 Filters
Filters are meant to increase the chance of spotting value with just one click or filter matches based on personal preferences to ease the in-play betting process. Read more about filters here: https://betballers.com/in-play-schedule-filters-functionality You can easily disable the filters that do not fit your needs.
2.3 Layout Settings
You can choose between the Separated Columns or Merged Columns layout. The latter means that there is no option to add “Last X stats” as a separate column, as these numbers are visible below the total number of stats. It gives you the chance to add more columns of other stats, for instance, to add multiple columns of likelihood stats. For the record, one of the latest columns we have added to the selection is called “Last X Pressure Index” stats. These stats are a total number of dangerous attacks; total shots and corners. The “Pressure Index Chart” settings do not affect the outcome of the given stats.
2.4 Pressure Index Chart
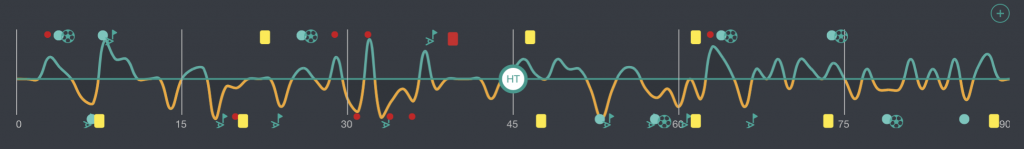
This is yet another great way to detect the momentum or understand better the course of the game. You can find the given chart on any match page, as well as on the app. The chart is calculated using real-time stats like dangerous attacks, shots on/off target, corners and cards. You can customise the formula by prioritising these stats based on your own preferences.
2.5 Dominance Settings
You can adjust the dominance formula yourself. Adjust the colour-coded stats to get the best experience that fits your needs. The default values are:
3. Notifications
Once the layout has been set, it is time to set up notifications. Therefore, start with reading the following article: https://betballers.com/how-to-create-custom-in-play-alerts-notifications/. It gives a quick overview how to set up notifications. Next, read more about the different rules and their meanings to get a better idea of all the options available here:
4. Notifications Backtesting
Everybody who loves notifications will appreciate this new feature even more. The backtesting system will help you save time by validating the profitability of notifications in mere minutes. The time-consuming days are over, when you had to gather enough data to understand whether a notification was profitable or not. From now on, in just minutes you can dial in your rules to find the best combination possible. Each backtest run is processing the last 40,000 finished games. Read more about backtesting here.
5. Likelihood and Variance (aka Error) Stats
If you are someone who likes to go into detail and is willing to go the extra mile to maximise profit, then you will be definitely interested in getting to know more about the Likelihood, as well as Variance stats. Click here to read more about these stats: https://betballers.com/explaining-the-likelihood-and-variance-aka-error-stats/ The great thing is that both of the stats can be used in an in-play column, as well as one of the rules in a custom notification.
6. Likelihood & Averages Scanner
These scanners are available on both the in-play and schedule page. Use them to filter games quickly based on different criteria of likelihood and averages stats. E.g. combine multiple likelihood stats and save them for easy use in the future.
7. Home Advantage Stats
Find out which teams perform better at home. The given stats are visible for each team page, each match page, as well as each league page. The formula itself is pretty simple:
Home Advantage = GF (Goals for) – GA (Goals against).
We have listed leagues (based on the last 25-50-75 games) with the highest, as well as the lowest home advantage stats on the statistics page here: https://betballers.com/dashboard/statistics/#tab_home-advantage As you can see, based on the last 50 games, playing at home gives a significant advantage in the following leagues:
Macedonia League Women (2.74),
Latvia League Women (2.18),
Finland Ykkonen Women (2.04)
On the contrary, it seems that playing at home makes no difference in cup games nor friendlies. Based on the last 50 games home advantages respectively:
Denmark Cup Women (-2.52),
Romania Cup Women (-2.14),
Australian Matches aka Australian Friendlies -1.78.
If you are already on the Statistics page, we recommend taking a look at other tabs as well. The Statistics page covers a wide range of different statistical rankings of teams and leagues. We are the most comprehensive football statistics site for good reason.
8. Mutual Opponents
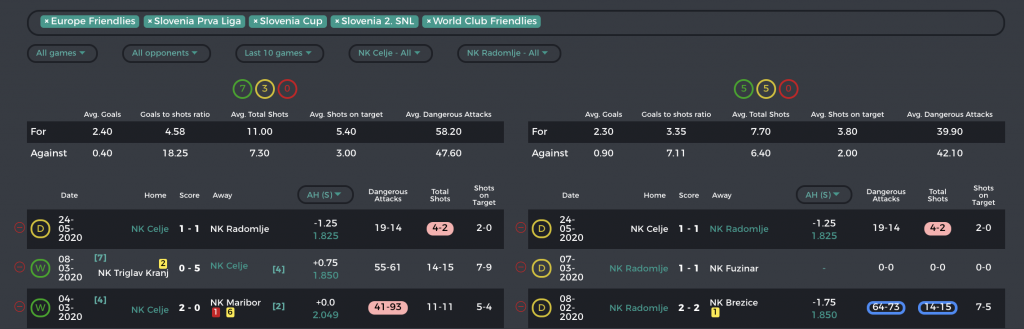
This has been one of the most popular features for our users. Click on the Comparison Tab and choose the Mutual opponents option on the first dropdown option on the match page. It gives you a great overview how both teams have played against the same opponents.
9. Win Rate of Covering the Starting Line
These stats show the win rate of last “X” number of games covering the initial line of Asian Handicap, Goal Line and Asian Corners. This section is visible on both the Home Previous or Away Previous tab and shows the asian handicap, goal line and asian corner results compared to starting lines that were set by the bookie. Therefore, you can discover teams that have been priced incorrectly or simply performed below bookies expectations. You can find easily the top teams with the highest win rate of covering the starting line on the league page.
10. App
The app provides all the everything in order to be successful on in-play betting. Filters? Check. Pressure index chart? Check. Mutual opponents? Check. Favourites? Check. Notifications? Check. The list goes on. Download the iOS app here and Android one here.
—-
So, what’s the feeling after having completed ten steps mastering BetBallers? Are you ready to take bookies down, make money like never before? Stay vigilant to maintain your discipline and keep doing your research. And that’s why we are here, to help you with that research.
Related posts
-

Top 5 Least Exciting Football Leagues to Bet On (2023)
While football is undoubtedly the most popular sport in the world, not all football leagues are created equal when it comes to betting. Some leagues offer plenty of opportunities for excitement and high-stakes betting, while others may not be as appealing to those looking to add some thrill to their viewing experience. In this article, […]
-

Top 5 Most Exciting Football Leagues to Bet On (2023)
Football, the world’s most popular sport, offers bettors a wealth of opportunities to engage in exciting and potentially lucrative wagers. With numerous leagues and competitions taking place across the globe, knowing where to place your bets can be overwhelming. In this post, we’ll take a closer look at the top 10 most exciting football leagues […]
-
Backtesting Results: 5 Winning strategies for Asian Handicap & Asian Corners bets (2020)
Many of you are already familiar with the backtesting system, but if you are not, we recommend reading the following article first: In-Play Notifications Backtesting System. In a nutshell, the backtesting system provides you a unique opportunity to determine your custom notifications’ profitability without need to collect data for months. With the latest update – […]
Latest updates
-
September 2023
We are thrilled to announce a new feature that will improve your experience on our platform. Say hello to the all-new Pressure Index Chart feature, now available in your in-play view! The Pressure Index Chart gives you a visual representation of the game’s dynamics, measuring the intensity and flow of the game in real-time. This […]
-
January 2023
We’ve just released an update to the app that includes a handy new feature for mobile bettors. The pressure index charts are now available on the in-play view and can be activated by toggling on the pressure index button. This feature is great for those looking for momentum on live games on the go. Just […]
-
October 2022
Two new significant features have been added to the app. From now on, it is possible to keep a record of teams better by adding match and team notes. You can add, edit and delete notes on the site or app as both results are synced. Set an alert to target specific odds and lines […]