Explaining the Likelihood and Variance (aka Error) stats
Variance Stats (aka Error Stats)
The variance stats show an average difference from the starting handicap line. It gives you an idea of whether a team is over/undervalued and shows which league/teams the market has priced most inaccurately in the past.
The calculation is: [Team’s score difference] -/+ [Team’s starting line]; always using the absolute value.
Here is an example of Asian Handicap error stats based on four games:
A home team’s starting Asian Handicap line is set at -0.5, they won the game 3-1; the average error equals 1.5[ 3-1 => 2 – 0.5 => 1.5]
A home team’s starting Asian Handicap line is set at -1, they lost the game 2-4; the average error equals 3[ 2-4 => -2 – 1 ) => abs(-3) => 3 ]
An away team’s starting Asian Handicap line is set at+0.75, the game ended 2-2; the average error equals 0.75[ 2-2 => 0 + 0.75 => 0.75 ]
A home team’s starting Asian Handicap line is set at +1.25, they won the game 1-0; the average error equals 2.25[ 1-0 => 1 + 1.25 => 2.25 ]
Based on these four games, the average error equals 1.875 => (1.5 + 3 + 0.75 + 2.25) / 4 (number of games).
Here is an example of Goal-line error stats based on four games:
The starting line of Goal-line is set at 2.5, the final score 3-1; the average error equals 1.5[ 3+1 => 2.5 – 4 => abs(-1.5)=> 1.5]
The starting line of Goal-line is set at 2.75, the final score 2-4; the average error equals 3.25[ 2+4 => 2.75 – 6 ) => abs(-3.25) => 3.25
The starting line of Goal-line is set at 4 , the final score 2-2; the average error equals 0[ 2+2 => 4 – 4 => 0 ]
The starting line of Goal-line is set 2,25, the final score 1-0; the average error equals 1.25[ 1+0 => 1 – 2.25 => abs(-1.25 ) => 1.25]
Based on these four games, the average error equals 1.5 => (1.5 + 3.25 + 0 + 1.25) / 4 (number of games).
The lower the number is, the more accurate the work the bookmakers have done with pricing games. We recommend taking a look at teams with a greater number as these teams have been harder to price for bookies and have more potential value. The same model applies to the Goal Line and Asian Corners market.
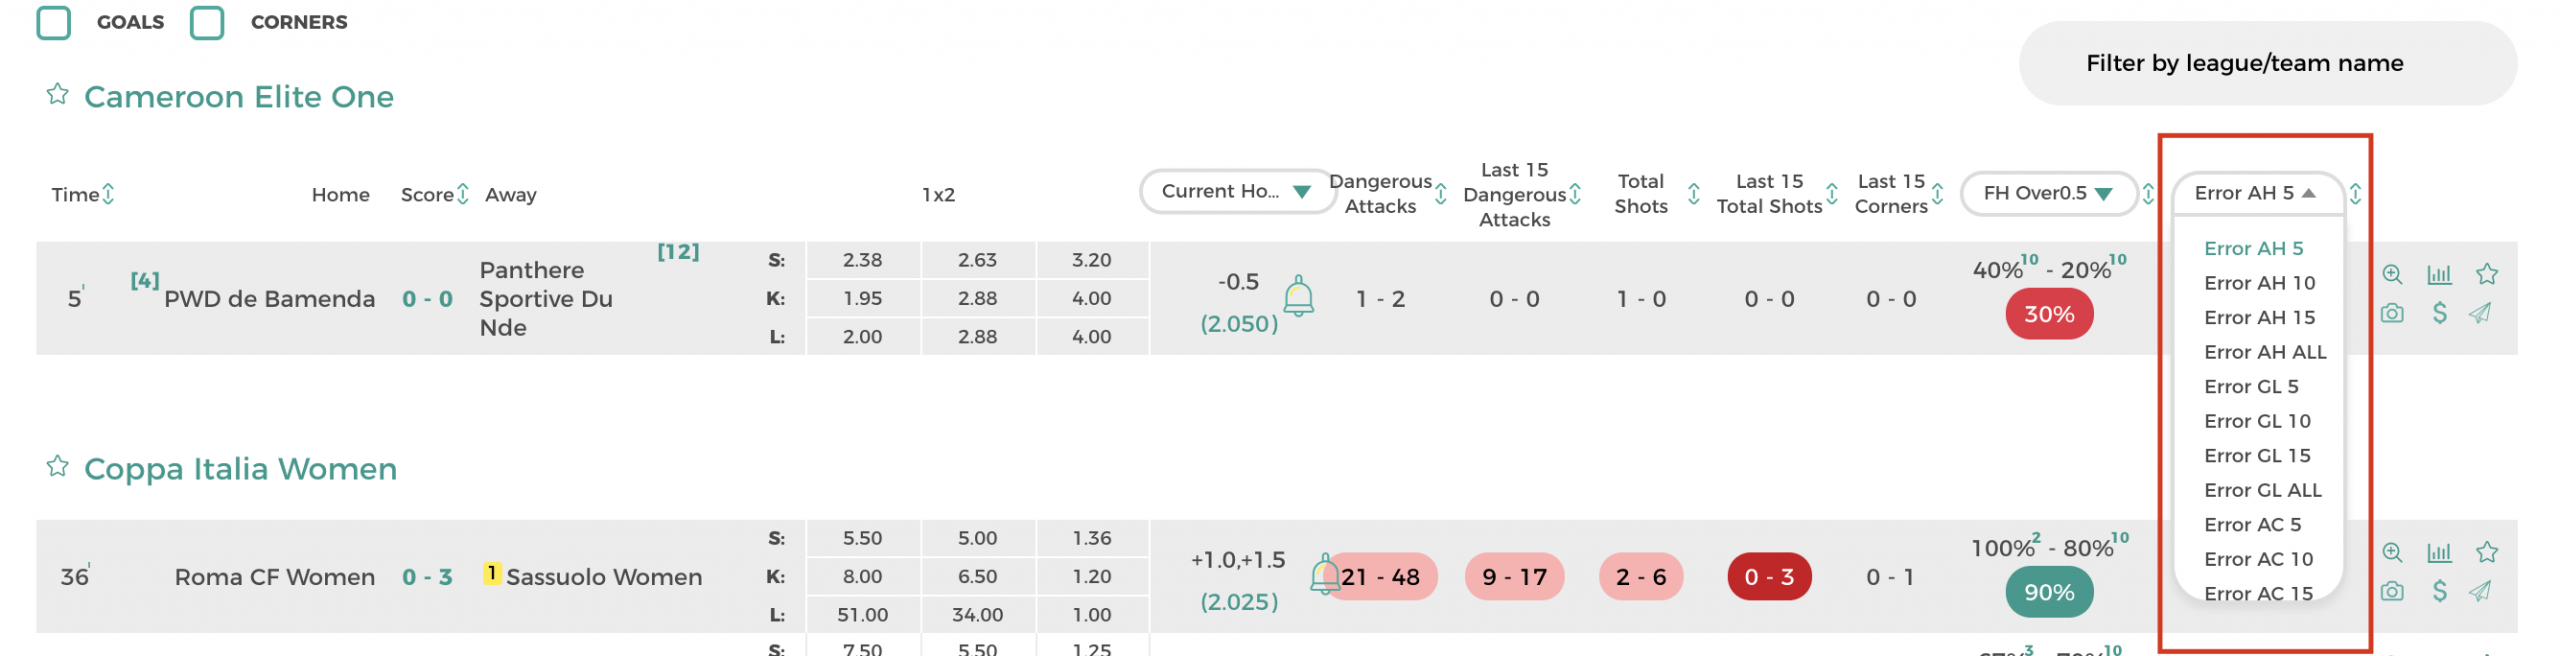
Error AH 5/10/15 – variance stats of Asian Handicap based on the last 5/10/15 games.
Error GL 5/10/15 – variance stats of Goal-Line based on the last 5/10/15 games.
Error AC 5/10/15 – variance stats of Asian Corners based on the last 5/10/15 games.
We have listed teams with the greatest average difference from the opening line (Asian Handicap & Goal Line & Asian Corners) on the Statistics page, as well as on every league page, for instance, England Championships.
Likelihood Stats
The purpose of statistics is to help identify outcomes that have happened on a highly regular or infrequent basis and to determine potential value bets.
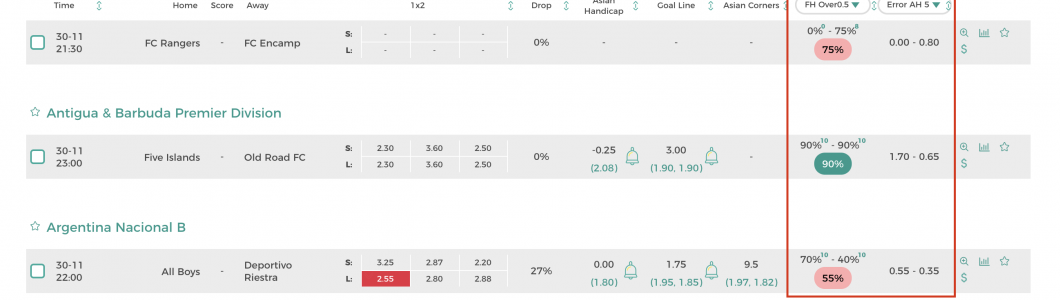
The numbers represent the % of times an event has happened thus far based on the previous results. For instance, FH Over 0.5 80%[8]. The small green number indicates the number of games these stats are based on. In the given case, the home side stats are based on the last 10 games, and 80% means that 8 times out of 10, they have either scored or conceded at least one goal in the first half. The away team, on the other hand, has scored or conceded at least one goal in all of the last 10 games. The number underneath (90%) these two is the average of both.
If these stats are very high or low, then this means it has happened on a very regular basis, and the likelihood is that there’s an increased probability it will happen again.
Green stats are designed to be mainly used for “Over” (Goal-line, Corners) markets.
Red stats are designed to be mainly used for “Under” (Goal-line, Corners) markets.
Pink/Yellow stats are a little less reliable to bet on, as these outcomes have been less consistent based on the team’s previous games. Yet, a high yellow stat like 80% on the “Winning Half-Time” or “Scored First-Half” market is still a quite reliable indicator in some cases.
It is never suggested to just blindly choose the highest percentages and create a “once in a lifetime” accumulator based on it. It is essential to conduct additional research using the team statistics, for example, and checking the current form, league, injuries, H2H, and so on. For instance, average stats of FH Over 0.5 goals can be 90%, but it could be that both sides have conceded in most of the games, and scored a few times only. It is advisable to avoid such games.
One thing that is recommended to use is the likelihood scanner on either the In-Play or Schedule page to filter the list of games by likelihood stats. This way, you can spot the potential value bets quickly.
Additionally, these stats can be used for creating custom notifications. Choose the Likelihood option from the Type dropdown, and then set the Event value, as well as any other values. Add more rules that are based on Odds and Stats to create powerful and instant in-play or pre-game alerts.
Read more about creating custom notifications here.
The Comeback Factor What is it? The Comeback Factor measures how effectively a team can recover after falling behind in a match. It tells you how often a team can bounce back by scoring the next goal after the other team has taken the lead. How does it work? Every time a team falls behind, […]
While football is undoubtedly the most popular sport in the world, not all football leagues are created equal when it comes to betting. Some leagues offer plenty of opportunities for excitement and high-stakes betting, while others may not be as appealing to those looking to add some thrill to their viewing experience. In this article, […]
Football, the world’s most popular sport, offers bettors a wealth of opportunities to engage in exciting and potentially lucrative wagers. With numerous leagues and competitions taking place across the globe, knowing where to place your bets can be overwhelming. In this post, we’ll take a closer look at the top 10 most exciting football leagues […]
AI Model Upgrade We’ve replaced the AI model that analyzes games to generate tips and predictions. The new model is in the GPT-5 class and performs on par with Gemini 3.0 Pro, providing deeper analysis and more accurate insights. In-Play & Tips Improvements The predictions list on the In-Play and Tips pages has been enhanced […]
New Feature: AI Assistant We’ve added an AI Assistant to help you find better betting opportunities and get quick match insights. Schedule Page Analysis AI now scans upcoming matches and highlights value bets with higher success probability Get specific betting tips with explanations instead of sorting through raw data yourself Live Match Intelligence New AI […]
Enhanced Winning and Comeback Statistics We’ve refined our winning and comeback formulas with two key improvements: New filtering option: You can now exclude 0-0 games from calculations for more accurate statistics Transparency feature: Hover over any stat to see the complete list of games used in the calculation These enhanced statistics are now available across […]
Why Choose BetBallers for Football Betting Statistics?
The most comprehensive football betting platform with live scores, in-play statistics, AI assistant, backtesting tools, and unique analytical features
Live Football Scores & In-Play Stats
Real-time match data with live scores, in-play statistics, dangerous attacks, and pressure index for informed betting decisions.
Live ScoresIn-Play StatsReal-Time Data
Comeback & Winning Factor Analysis Unique
Proprietary metric measuring how teams recover after falling behind - exclusive to BetBallers for underdog betting strategies.
Comeback FactorUnderdog StatsWinning Factor
Football Betting Statistics & Odds
Complete match statistics including corners, shots, Asian handicap data, head-to-head records, and betting odds comparison.
StatisticsBetting OddsAsian Handicap
Momentum Betting Tracker aka Pressure Index
Track game momentum shifts in real-time to identify betting opportunities during live matches with visual momentum indicators.
MomentumLive BettingMatch Flow
Match Schedule, Results & Standings
Complete fixture schedule, historical results, league standings, and pre-match analysis for Premier League, La Liga, and 100+ leagues.
ScheduleResultsStandings
Customizable Betting Alerts
Set personalized notifications for goals, corners, cards, and statistical thresholds across your favorite teams and leagues.
AlertsNotificationsCustom
AI Betting Assistant & Agent AI Powered
Intelligent AI agent analyzes matches, suggests betting opportunities, and provides data-driven insights based on historical patterns and live statistics.
AI AssistantSmart PredictionsAI Agent
Betting Strategy Backtesting Pro
Test your betting strategies against historical data, analyze ROI, track performance metrics, and optimize your betting approach with proven results.
Everything you need to know about football betting statistics, live scores, and using BetBallers effectively
What statistics and features does BetBallers provide for football betting?
BetBallers is a comprehensive tool designed for football bettors to enhance in-play and pre-game betting performance. The platform provides:
Live Match Statistics: Real-time stats including dangerous attacks, corners, shots, and pressure index for all in-play matches
Likelihood Stats: Color-coded system covering all markets from First Half Overs to Corners, making it easy to spot whether odds are backed by statistics
Variance Stats: Shows average differences from starting lines for Asian Handicap, Goal Line, and Asian Corners to identify mispriced teams in seconds
Comeback Factor: Measures how effectively teams recover after falling behind by tracking how often they score the next goal
xG Stats: Expected goals available on both match pages and in-play pages within the likelihood stats column
Pressure Index: Combines dangerous attacks, total shots, and corners to measure which team is dominating the match
The platform features a customizable and user-friendly layout with the best coverage of games to ensure you never miss potential betting opportunities.
How does the BetBallers notification system work?
BetBallers offers a powerful notification system that significantly reduces the chance of missing potential bets:
Custom Notifications: Create pre-set or fully customizable notifications using combinations of real-time stats, likelihood stats, averages, and odds
Automated Scanning: The system automatically scans all in-play games and alerts you when your criteria is met
Visual Alerts: Notifications appear on the top right corner when matches meet your set criteria
Results Tracking: The system tracks all notifications received with results easily filterable by different options
Example notification: Alert for home underdogs losing by 1 goal but with 66%+ Pressure Index, Asian Handicap +0.5, and kick-off odds under 5.00. This specific notification has achieved a 71% win rate (52 wins, 21 losses) in backtesting.
What is the Backtesting System and how does it work?
The Backtesting System is a game-changing feature that validates your in-play betting strategies in minutes instead of waiting months for results:
Massive Data Analysis: Every test analyzes the last 100,000 finished games (approximately 5-6 months of matches) from the database
Live Scenario Simulation: Simulates live betting scenarios based on your custom notification rules for each game
Retrospective Likelihood Stats: Each game's likelihood stats are calculated retrospectively from that particular match for accurate testing
Results in Minutes: Get comprehensive backtest results in minutes or even seconds, depending on your rule complexity
Advanced Filtering: Filter results by Asian Handicap, Goal Line, Asian Corners, specific days, goals scored within 2 minutes, or missing dangerous attacks
The backtesting system excludes E-Soccer, Beach Soccer, and other shortened matches to ensure data quality. This feature is available to all Gold-Ballers subscription users (1, 3, or 6-month plans).
How does the AI Assistant enhance betting decisions?
BetBallers' AI Assistant helps identify the best value bets and provides quick match insights to enhance your betting strategy:
Schedule Page Analysis: AI scans upcoming matches and highlights value betting opportunities with higher probability of success
Specific Betting Tips: Get concrete betting recommendations with explanations instead of sorting through raw data yourself
Live Match Intelligence: Each live game includes an AI assistant tab providing real-time analysis based on your customized dataset preferences
Quick Match Overviews: Get instant summaries of match situations without manually reviewing all statistics
The AI Assistant helps you make faster, more informed betting decisions by processing complex statistical relationships that would be time-consuming to analyze manually.
What is the Comeback Factor and how can I use it for betting?
The Comeback Factor is a unique BetBallers metric that measures how effectively a team can recover after falling behind in a match:
What it measures: Tracks how often a team scores the next goal after the opponent has taken the lead
How it works: Every time a team falls behind, the system records whether they manage to score the next goal or not
Enhanced accuracy: You can exclude 0-0 games from calculations for more accurate statistics (feature added January 2025)
Transparency: Hover over any Comeback Factor stat to see the complete list of games used in the calculation
Use the Comeback Factor to identify teams with strong resilience when trailing, creating valuable in-play betting opportunities when these teams fall behind. The enhanced statistics are available across multiple pages including team profiles and head-to-head comparisons.
How do Likelihood Stats help identify value bets?
Likelihood Stats are one of BetBallers' most powerful features, using an eye-catching color-coding system to show whether current odds are backed by historical statistics:
Comprehensive Market Coverage: Covers all possible markets from First Half Overs to Corners and everything in between
Color-Coded Indicators: Visual system makes it easy to spot at a glance whether odds represent good value or not
Historical Validation: Shows how current match statistics compare to historical performance patterns
In-Play Integration: Now includes xG stats directly in the likelihood stats column for even more insights
Combine Likelihood Stats with live statistics to avoid situations where real-time stats aren't backed up by historical performance. This dual approach helps identify genuinely profitable betting opportunities rather than statistical anomalies.
What are Variance Stats and how do they identify mispriced teams?
Variance Stats (also called Error Stats) show the average difference from starting lines, helping you identify mispriced teams in seconds:
Asian Handicap Variance: Shows which teams consistently outperform or underperform their handicap lines
Goal Line Variance: Identifies teams whose matches regularly go over or under expected totals
Asian Corners Variance: Reveals teams that generate more or fewer corners than bookmakers expect
Quick Identification: Find the most mispriced teams in your league or competition instantly
Variance Stats help you exploit consistent market inefficiencies by showing which teams the bookmakers systematically misprice across the most popular betting markets.
What is the Pressure Index and how is it calculated?
The Pressure Index is a composite statistic that measures which team is dominating a match by combining multiple attacking metrics:
Dangerous Attacks: Genuine scoring opportunities where the attacking team gets into dangerous positions
Total Shots: All shot attempts including both on-target and off-target efforts
Percentage Display: Shows as a percentage (e.g., 66% means one team has twice the combined attacking stats)
Use Pressure Index in custom notifications to identify matches where one team is dominating but hasn't scored yet. For example, a notification for home teams with 66%+ Pressure Index while losing 1-0 achieved a 71% win rate in backtesting across 100,000 games.
What subscription plans does BetBallers offer and what features are included?
BetBallers offers a free trial and multiple subscription tiers to suit different betting needs:
Free 2-Day Trial: €4.90 - Test all features with full access for 2 days
1-Month Gold-Baller: €29.99 - Full access to all features including AI Assistant and backtesting system
6-Month Gold-Baller: €149.90 - Extended subscription with significant savings per month
All Gold-Baller subscriptions include:
Live scores and in-play statistics for all major leagues
Custom notification system with unlimited alerts
Backtesting system (100,000 games analysis)
AI Assistant for schedule and live match analysis
Likelihood Stats with color-coding for all markets
Variance Stats for Asian Handicap, Goal Line, and Corners
Comeback Factor and Pressure Index statistics
xG Stats on match and in-play pages
Note: The 2-day trial does not include access to the backtesting system. Backtesting is only available with 1, 3, or 6-month Gold-Baller subscriptions.
What are xG (Expected Goals) stats and how can I use them for betting?
Expected Goals (xG) is an advanced metric that measures the quality of scoring chances by calculating the probability that a shot will result in a goal:
Available on Multiple Pages: View xG stats on both the match page and the in-play page for comprehensive analysis
Likelihood Stats Integration: Enable xG display to see these valuable insights directly in the likelihood stats column during live matches
Quality vs Quantity: xG reveals whether a team is creating genuine scoring opportunities or just accumulating low-quality shots
Value Betting Indicator: When a team has high xG but hasn't scored, it often indicates the score doesn't reflect match dominance
How to use xG for in-play betting:
Compare xG to actual score - if Team A has 2.3 xG but is losing 0-1, they may be unlucky and due for goals
Look for xG gaps between teams - a 1.5+ xG difference suggests one team is creating significantly better chances
Combine with Pressure Index - high xG plus 66%+ Pressure Index confirms genuine dominance
Use in notifications - create alerts for matches where xG doesn't match the scoreline for value betting opportunities
xG stats were added to the in-play page in August 2024, making BetBallers one of the few platforms to provide real-time expected goals data during live matches for immediate betting decisions.
How do I create effective custom notifications using BetBallers?
Creating effective custom notifications involves combining different statistics and using the backtesting system to validate profitability:
Mix Different Stats: Combine real-time stats, likelihood stats, averages, and odds for more accurate filtering
Use Likelihood Validation: Include likelihood stats to ensure real-time performance is backed by historical patterns
Test Thoroughly: Run backtests on your notifications to validate profitability across 100,000 historical matches
Refine and Iterate: If results are unsatisfactory, tweak your rules and run backtests again until you find winning combinations
Filter Results: Use filters to exclude games with incomplete stats or where goals were scored within 2 minutes of notification
Example winning notification:
Home underdog, losing by 1 goal, with 66%+ Pressure Index, current Asian Handicap +0.5 (minimum odds 1.80), and kick-off 1X2 odds under 5.00. This achieved 71% win rate (52 wins from 73 matches).
Fine-tuning takes time, but the backtesting system dramatically speeds up the process by providing instant validation instead of waiting months for real-world results.