Information
- Misc
- Filters
- Notifications
- Variance & Likelihood
Direct
-
S: 2.05 3.00 3.60 - Cotes de départK: 2.00 3.00 5.00 - Cotes du coup d'envoiL: 1.67 3.50 5.00 - Dernières cotes
La couleur rouge signifie que les cotes ont changé de 30% ou plus depuis l'ouverture des marchés et que le score du jeu est pair. Les points de couleur jaune sur les cotes changent de 15-30%.
Matchs complets1ère mi-temps2ème mi-tempsFiltrez les parties par mi-temps, l'onglet de la deuxième mi-temps ne montre que les statistiques de la deuxième mi-temps.
-
15-3
One of the team has 80%+ of Dangerous Attacks
[e.g (15 / (15+3) * 100) = 83%] -
12-4
One of the team has 65% - 79% of Dangerous attacks
[e.g (12 / (12+4) * 100) = 75%] -
10-4
Underdog a 50%+ Attaques Dangereuses, en plus la ligne de Handicap Asiatique est sur +0.5 ou plus haut.
- Classer la liste en jeu en fonction des valeurs des colonnes.
-
- Marchés disponibles avec les cotes
2 1- Nombre de cartons jaunes/rouges dans le match
Résultats
-
Classement des outsiders
- List teams who were not favourites based on the 1x2 starting odds
Calendrier
-
Cotes décroissantes
- Énumérer les équipes avec des changements plus importants dans les cotes.
Single view
-
Reussite Demi-reussite Vide Demi-perte Perte Vous pouvez basculer entre les résultats de l'Asian Handicap & Goal line. Il peut aider à trouver les équipes performantes et celles dont le prix a été mal évalué par les bookmakers.
We have designed a range of filters for any taste, from corner to over bettors. Use them to increase the chance of spotting value bets or just filter matches based on personal preferences to ease the in-play betting process. Read below about the filters that are on the site and get to know their functionality to make most of them.
In-Play Filters
- SCORE (0 – 0) – Match’s current score is 0-0
- SCORE EVEN (E.G. 1-1, 2-2) – Match’s current score is a draw
- STARTING DROPPING ODDS (LAST) – Matches where 1×2 odds have changed significantly (10% or more) based on the difference between starting and last odds
- STARTING DROPPING ODDS (KICK-OFF) – Matches where 1×2 odds have changed significantly (10% or more) based on the difference between starting and kick-off odds
- KICK-OFF DROPPING ODDS – Matches where 1×2 odds have changed significantly (10% or more) based on the difference between kick-off and last odds
- MOMENTUM CHANGE – When one of the teams has in the « Last 15 minutes dangerous attacks » column over 80 percent or an underdog has performed well with the Asian Handicap set +0,5 or higher and has in the « Last 15 minutes dangerous attacks » column over 65 percent.
- FAVOURITE TEAM IS LOSING (BASED ON KICK-OFF ODDS) – Matches where a team with -0.5 Asian Handicap or even lower line is currently losing based on kick-off odds
- FAVOURITE TEAM IS LOSING (BASED ON CUR. AH ODDS) – Matches where a team with -0.5 Asian Handicap or even lower line is currently losing based on current odds
- UNDERDOG PERFORMING WELL – Underdog’s Asian Handicap is higher than +0.5 and their total percentage of Dangerous Attacks is 65 percent or higher
- FAVOURITE TEAM PERFORMING WELL – A team on minus Asian Handicap is performing extremely well and has a Dangerous Attacks count of 80 percent or higher
- EVEN TEAMS – Matches where the Asian Handicap line is set either at 0 or -0.25/+0.25
- CORNERS MOMENTUM – Matches where there is a shift in momentum of corners in 2nd half. For example, when the home side is up 2-0 on corners going into Half-Time, but then away side counters 2-0 on corners in the 2nd half (2-2). Some of the corners in matches will be early pressure but this filter would provide the chance to see if the wind has an effect on the game.
- GOAL DIFFERENCE 1 – The score difference is one goal
- GOAL DIFFERENCE 2 – The score difference is two goals
- FH OVER 0.5 – Matches where the 1st-half Goal-line is set on 0.5
- AC MARKET – Matches available in the Asian Corners market on the In-Play or Schedule page
- H2H – Matches with head to head statistics
- H2H AH – Matches where one team has covered the initial Asian Handicap line at least 80% of the time based on head to head matches
- H2H GL OVER – Matches where the initial “Over” line of Goal-line has been covered at least 80% of the time based on head to head matches
- H2H GL UNDER – Matches where the initial “Under” line of Goal-line has been covered at least 80% of the time based on head to head matches
Likelihood filters
- GOALS – Likelihood stats of different goal markets based on the last 10 games.
- CORNERS – Likelihood stats of different corner markets based on the last 10 games.
Filters on the Match Page
- SHOW HOME – Team’s matches played at own venue
- SHOW AWAY – Team’s matches played at opponent’s venue
- SHOW WITH DROPPING ODDS – Matches where 1×2 odds have changed significantly (10% or more) based on the difference between starting and kick-off odds
- SHOW LOST AS FAVOURITE – Matches where the team was on minus Asian Handicap line but lost the game
- SHOW WON AS UNDERDOG – Matches where the team was on plus Asian Handicap line but won the game
- w/o stats – Matches with partial statistics
- SHOW 1ST HALF STATS – Statistics at half-time
In-play alerts have an important role during live football matches in betting nowadays. Every profitable football bettor knows it. Users of the BetBallers platform can create custom notifications based on live stats such as dangerous attacks, total shots, corners, cards, odds, and more. Notifications will increase the chance of finding suitable bets based on your preferences. This is especially useful when the alert is cross-referenced with the data in previous games, H2H, team info, and comparison (mutual opponents) tabs.
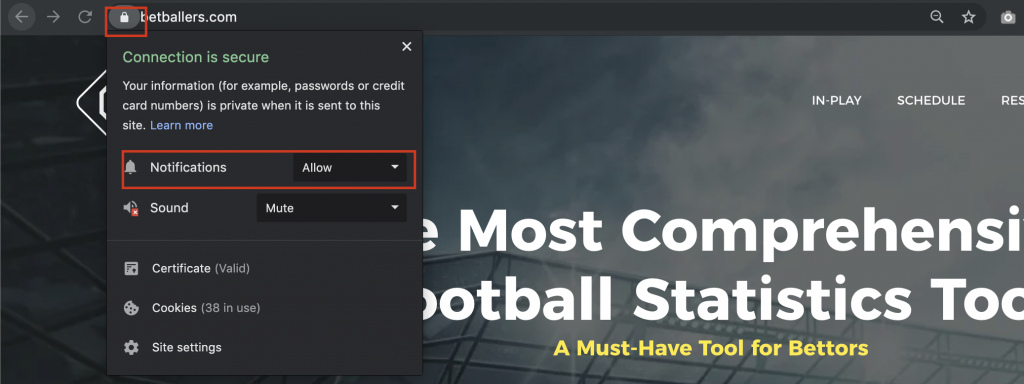
Before you begin with notifications, please be aware that Push Notifications have to be allowed on the Google Chrome browser. You will also need to decide whether to allow notifications when installing the app. This way notifications can be received on either iOS or Android devices.
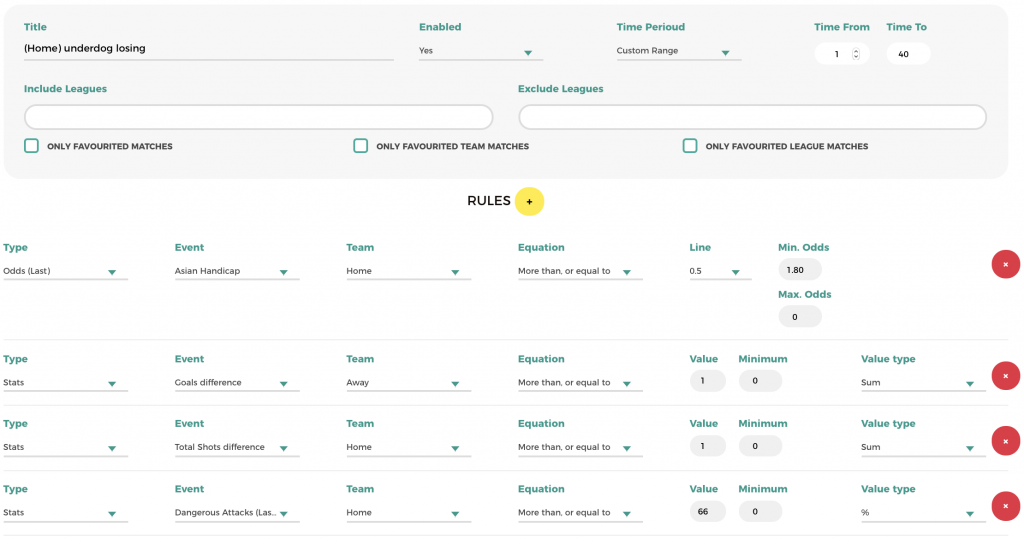
Next, let’s take a closer look at the two examples below on how to create your in-play betting strategies.
The first notification detects home underdog based on the following criteria:
- Time range: 1-40th minute
- Away team leading by one or more goals
- Home has one or more shots than away
- Home has double (66% – e.g. 10-5) or more dangerous attacks than away in the last 15 minutes
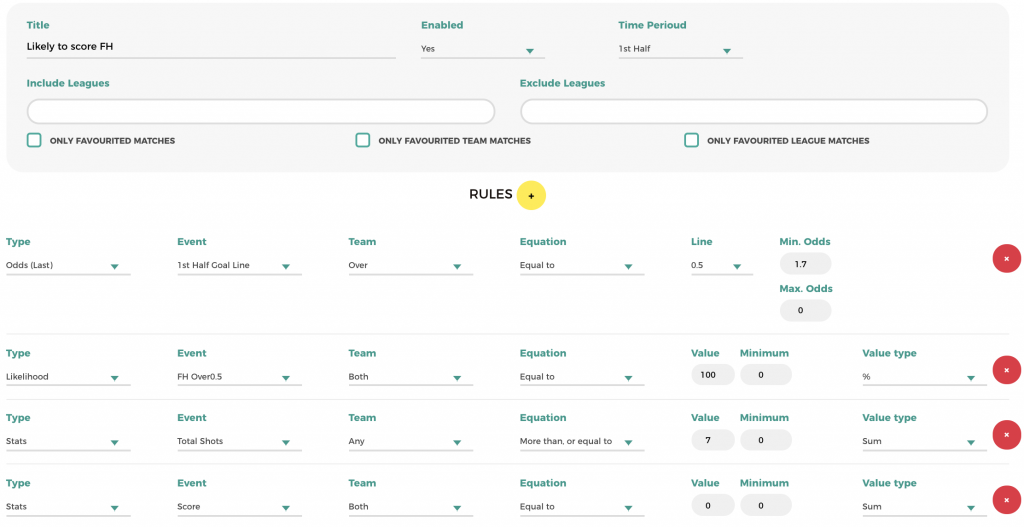
The second alert
- Time range: 1st Half
- Goal-line 0.5 (based on the last/current odds) with odds 1.7 and greater
- Likelihood event is set on « FH Over 0.5 » and the average of home and away is 100%
- One of the teams has 7 or more total shots
- Score 0-0
Tracking Results
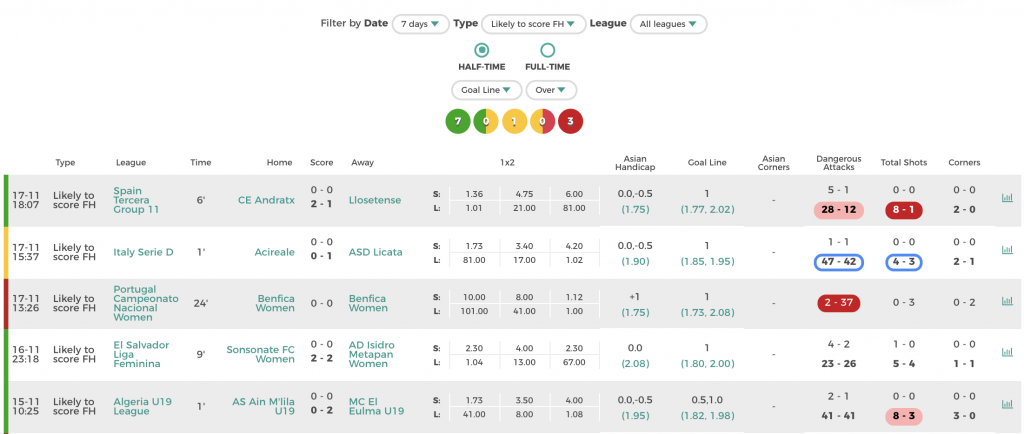
We have built a filter (take a look at the image below) to track the results of notifications. You can filter results by date, type/name, league, half-time or full-time stats, as well as the following markets: (1st-half) Asian Handicap, (1st-half) Goal-line, (1st-half) Asian Corners.
Each stats column shows two numbers: stats of the moment when the notification was sent out; the number underneath shows either the final stats at half-time or full-time.
The result of the notification based on an active market and line is visible before each row on the left side. For instance, on the picture below all the results are calculated based on the 1st-half Goal-Line (Over).
The meanings of colours:
- Green – Win
- Green/Yellow – Half-win
- Yellow – Refund
- Red/Yellow – Half-loss
- Red – Loss
- Grey – Result undetermined yet
Variance Stats (aka Error Stats)
The variance stats show an average difference from the starting handicap line. It gives you an idea of whether a team is over/undervalued and shows which league/teams the market has priced most inaccurately in the past.
The calculation is: [Team’s score difference] -/+ [Team’s starting line]; always using the absolute value.
Here is an example of Asian Handicap error stats based on four games:
- A home team’s starting Asian Handicap line is set at -0.5, they won the game 3-1; the average error equals 1.5 [ 3-1 => 2 – 0.5 => 1.5 ]
- A home team’s starting Asian Handicap line is set at -1, they lost the game 2-4; the average error equals 3 [ 2-4 => -2 – 1 ) => abs(-3) => 3 ]
- An away team’s starting Asian Handicap line is set at+0.75, the game ended 2-2; the average error equals 0.75 [ 2-2 => 0 + 0.75 => 0.75 ]
- A home team’s starting Asian Handicap line is set at +1.25, they won the game 1-0; the average error equals 2.25 [ 1-0 => 1 + 1.25 => 2.25 ]
Based on these four games, the average error equals 1.875 => (1.5 + 3 + 0.75 + 2.25) / 4 (number of games).
Here is an example of Goal-line error stats based on four games:
- The starting line of Goal-line is set at 2.5, the final score 3-1; the average error equals 1.5 [ 3+1 => 2.5 – 4 => abs(-1.5)=> 1.5 ]
- The starting line of Goal-line is set at 2.75, the final score 2-4; the average error equals 3.25 [ 2+4 => 2.75 – 6 ) => abs(-3.25) => 3.25
- The starting line of Goal-line is set at 4 , the final score 2-2; the average error equals 0 [ 2+2 => 4 – 4 => 0 ]
- The starting line of Goal-line is set 2,25, the final score 1-0; the average error equals 1.25 [ 1+0 => 1 – 2.25 => abs(-1.25 ) => 1.25]
Based on these four games, the average error equals 1.5 => (1.5 + 3.25 + 0 + 1.25) / 4 (number of games).
The lower the number is, the more accurate the work the bookmakers have done with pricing games. We recommend taking a look at teams with a greater number as these teams have been harder to price for bookies and have more potential value. The same model applies to the Goal Line and Asian Corners market.
Error AH 5/10/15 – variance stats of Asian Handicap based on the last 5/10/15 games.
Error GL 5/10/15 – variance stats of Goal-Line based on the last 5/10/15 games.
Error AC 5/10/15 – variance stats of Asian Corners based on the last 5/10/15 games.
We have listed teams with the greatest average difference from the opening line (Asian Handicap & Goal Line & Asian Corners) on the Statistics page, as well as on every league page, for instance, England Championships.
Likelihood Stats
The purpose of statistics is to help identify outcomes that have happened on a highly regular or infrequent basis and to determine potential value bets.

The numbers represent the % of times an event has happened thus far based on the previous results. For instance, FH Over 0.5 80%[8]. The small green number indicates the number of games these stats are based on. In the given case, the home side stats are based on the last 10 games, and 80% means that 8 times out of 10, they have either scored or conceded at least one goal in the first half. The away team, on the other hand, has scored or conceded at least one goal in all of the last 10 games. The number underneath (90%) these two is the average of both.
If these stats are very high or low, then this means it has happened on a very regular basis, and the likelihood is that there’s an increased probability it will happen again.
- Green stats are designed to be mainly used for « Over » (Goal-line, Corners) markets.
- Red stats are designed to be mainly used for « Under » (Goal-line, Corners) markets.
- Pink/Yellow stats are a little less reliable to bet on, as these outcomes have been less consistent based on the team’s previous games. Yet, a high yellow stat like 80% on the « Winning Half-Time » or « Scored First-Half » market is still a quite reliable indicator in some cases.
It is never suggested to just blindly choose the highest percentages and create a « once in a lifetime » accumulator based on it. It is essential to conduct additional research using the team statistics, for example, and checking the current form, league, injuries, H2H, and so on. For instance, average stats of FH Over 0.5 goals can be 90%, but it could be that both sides have conceded in most of the games, and scored a few times only. It is advisable to avoid such games.
One thing that is recommended to use is the likelihood scanner on either the In-Play or Schedule page to filter the list of games by likelihood stats. This way, you can spot the potential value bets quickly.
Additionally, these stats can be used for creating custom notifications. Choose the Likelihood option from the Type dropdown, and then set the Event value, as well as any other values. Add more rules that are based on Odds and Stats to create powerful and instant in-play or pre-game alerts.
Read more about creating custom notifications here.


